Sarenica Desktop
Track focus, stillness, drowsiness, screen time, keyboard rhythm, and mouse activity locally on Windows.

See your working day as it happens.
A guided tour of focus, stillness, drowsiness, screen time, keyboard cadence, and mouse activity in the native Windows app.
Every block, every signal — one read.
Each bubble is one work session. Bigger means longer. Higher means more tired. Color shows your output while active. One chart, every signal layered together — built from your real days.
How each detector works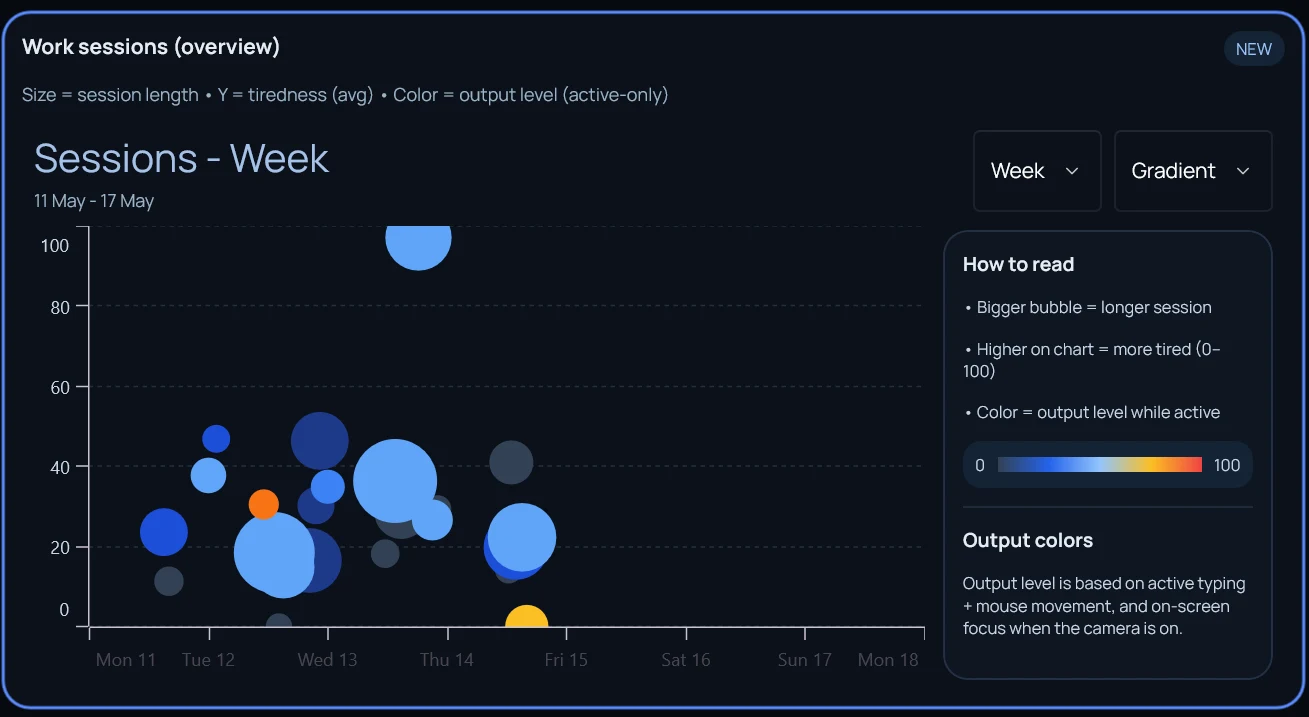
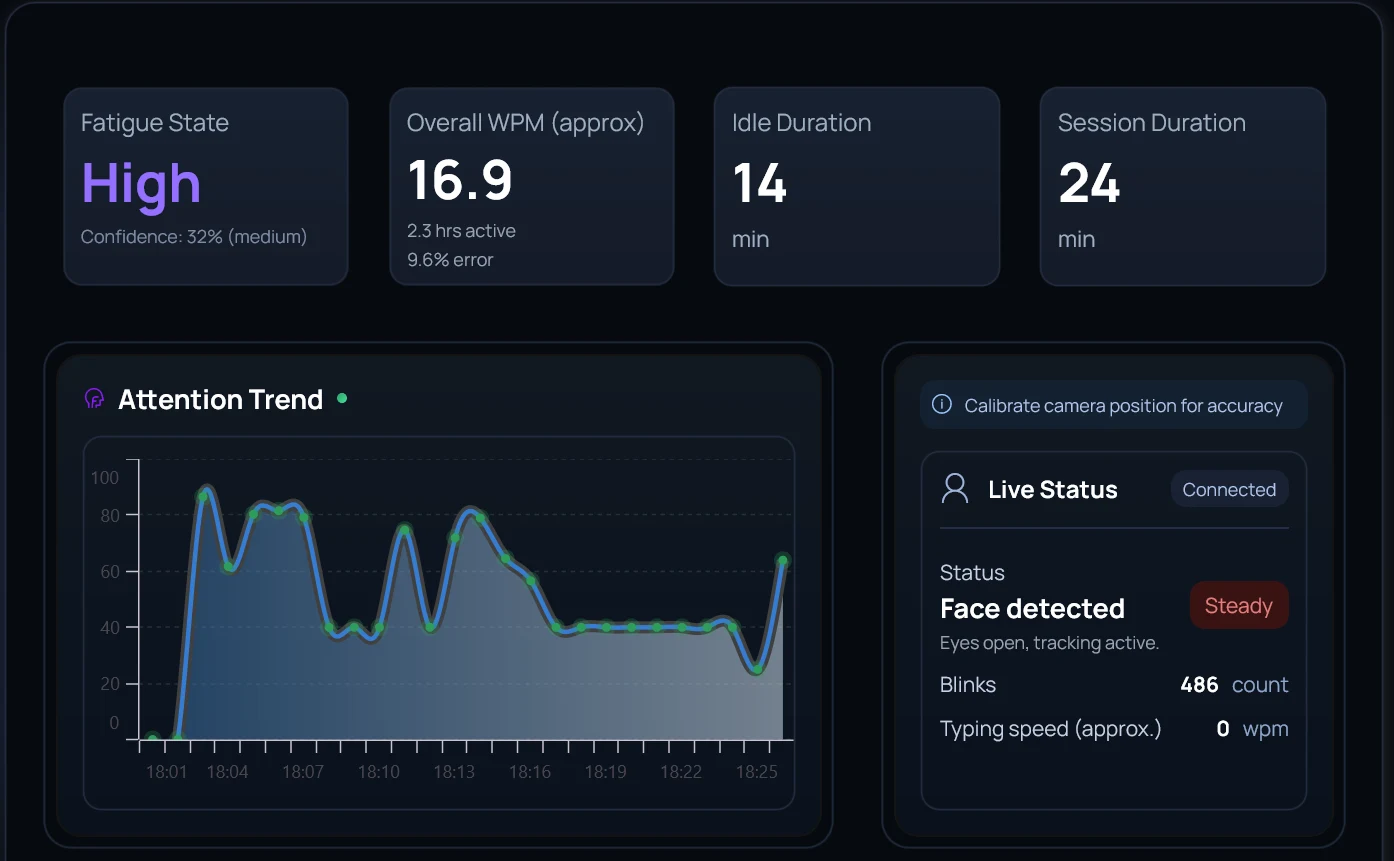
Every signal, while you work.
Fatigue state, typing speed, idle stretches, session length — all updated live as the detectors sample. The attention trend tracks the curve of your block; face detection confirms the camera-based signals are honest.
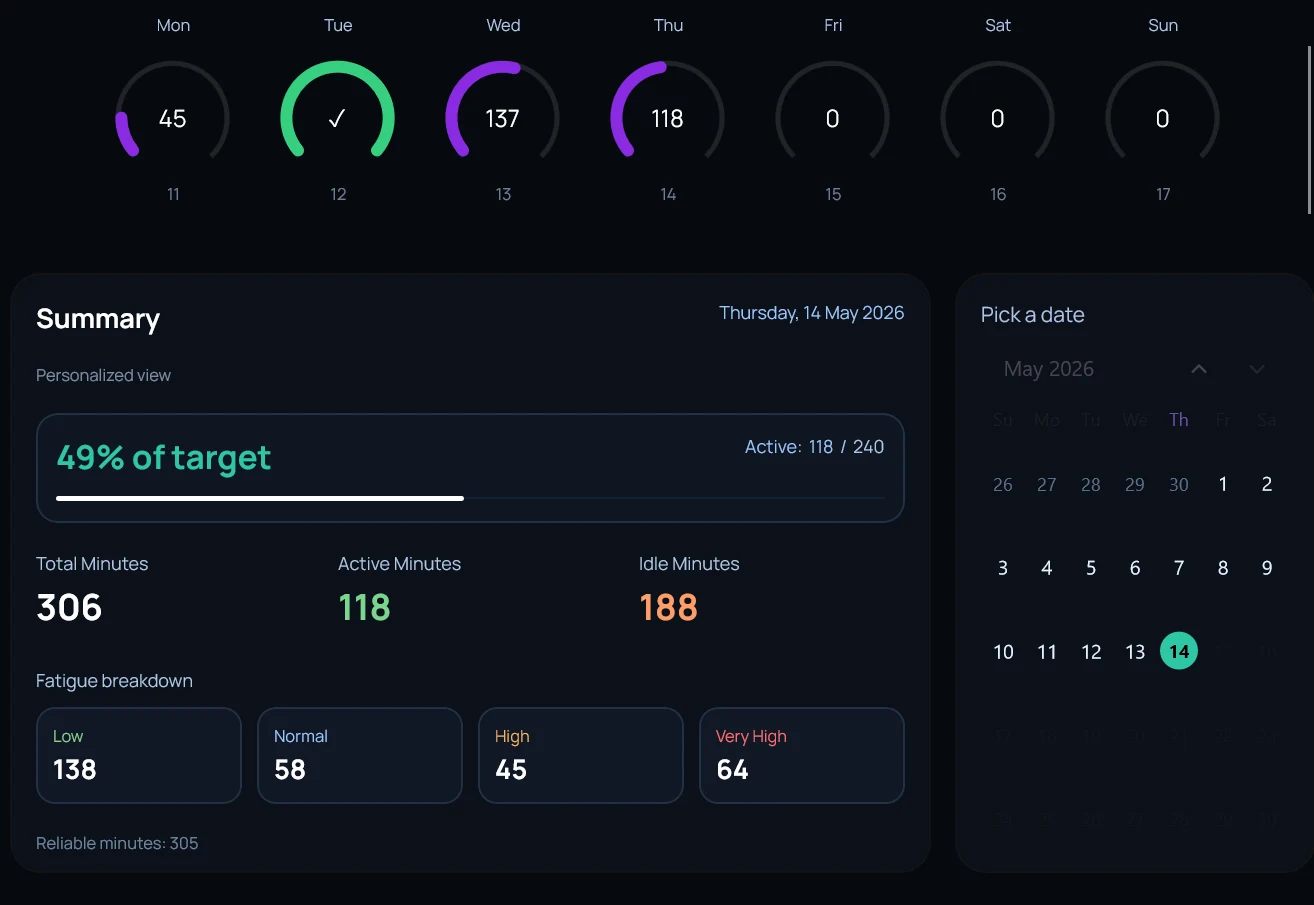
See every day. Track every week.
Daily gauges show your progress against an active-minute target. A weekly summary breaks down active vs idle minutes and how fatigue distributed across the week. Jump to any historical date to revisit it.
Catches the dip you would miss.
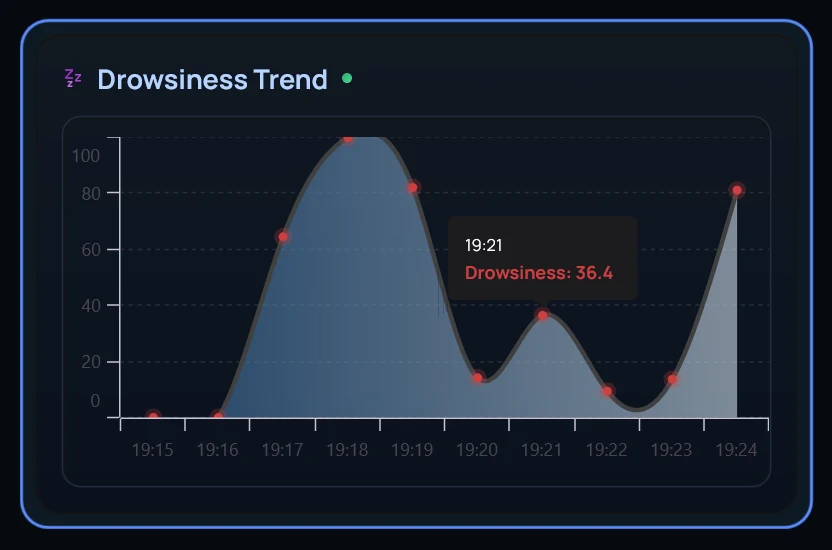
PERCLOS — percentage of eyelid closure over a moving window — is the strongest in-the-moment drowsiness signal. The chart marks every spike so you can see exactly when the day started costing you.
Down to the keystroke, the click, the pause.
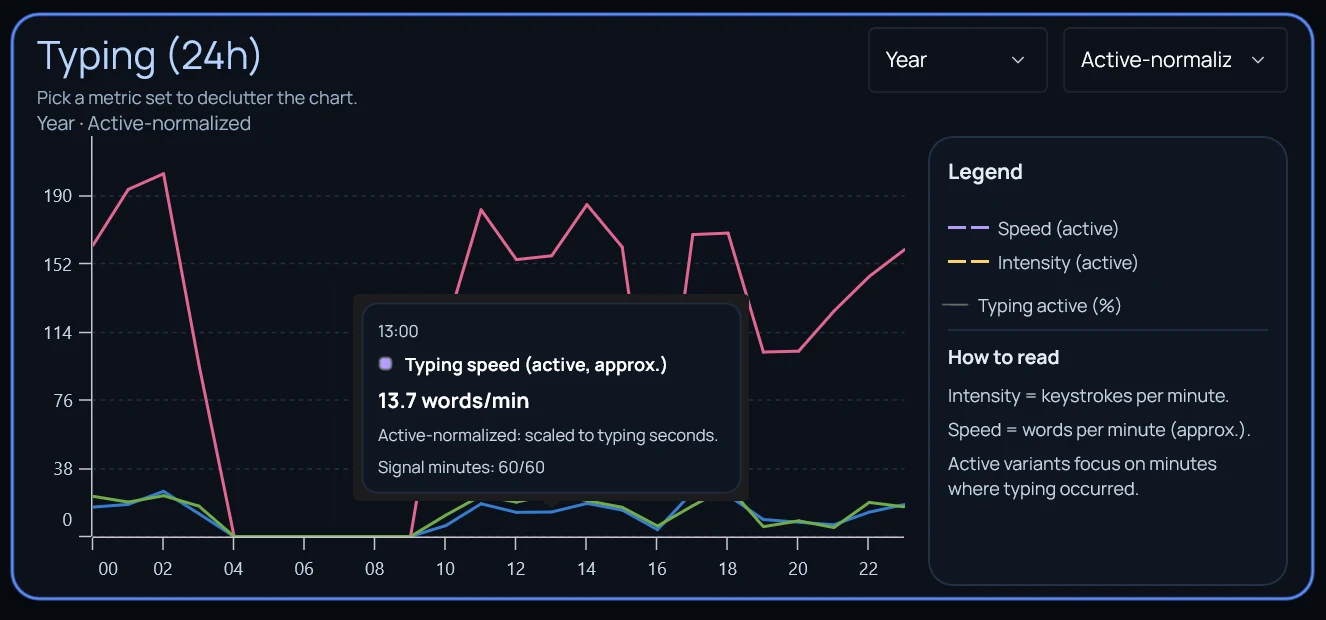
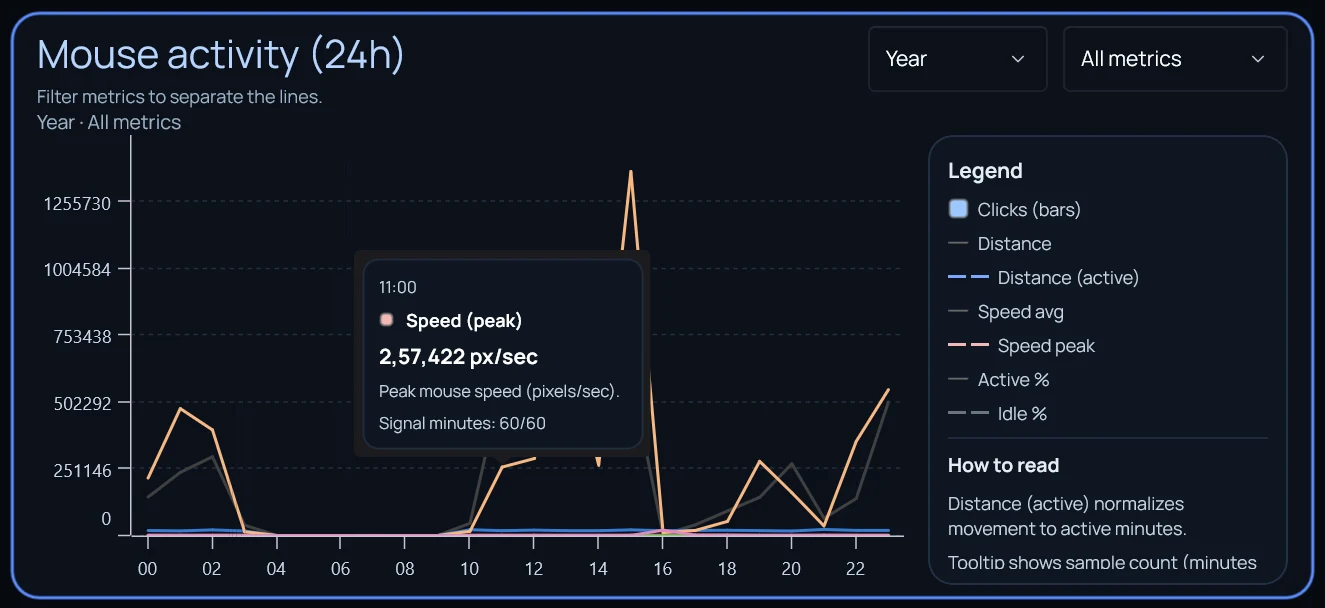
Every detector has its own deep view. Typing tracks speed, intensity, and error rate. Mouse tracks clicks, distance, peak speed, and idle stretches. Drill in whenever a weekly read flags an unusual shift.
Six detectors. One baseline.
Each signal is computed independently, but read together. That is what lets Hydrogen say which one actually moved when your week changed.
Sustained-attention sessions. When did you actually settle in, and for how long.
Cumulative strain, eyelid closure, and the dip that builds before you notice it.
Movement, head pose, and shoulder line, sampled passively. No video stored.
Blink rate, eyes-closed events, and microsleeps from camera frames.
How your typing rhythm changes through the day. A subtle fatigue tell.
The pauses that mean a break, and the ones that mean drift.
Turn signals into something you can test.
Desktop collects the evidence first. Lab helps you investigate a question, and Bench turns a useful finding into a personal experiment.
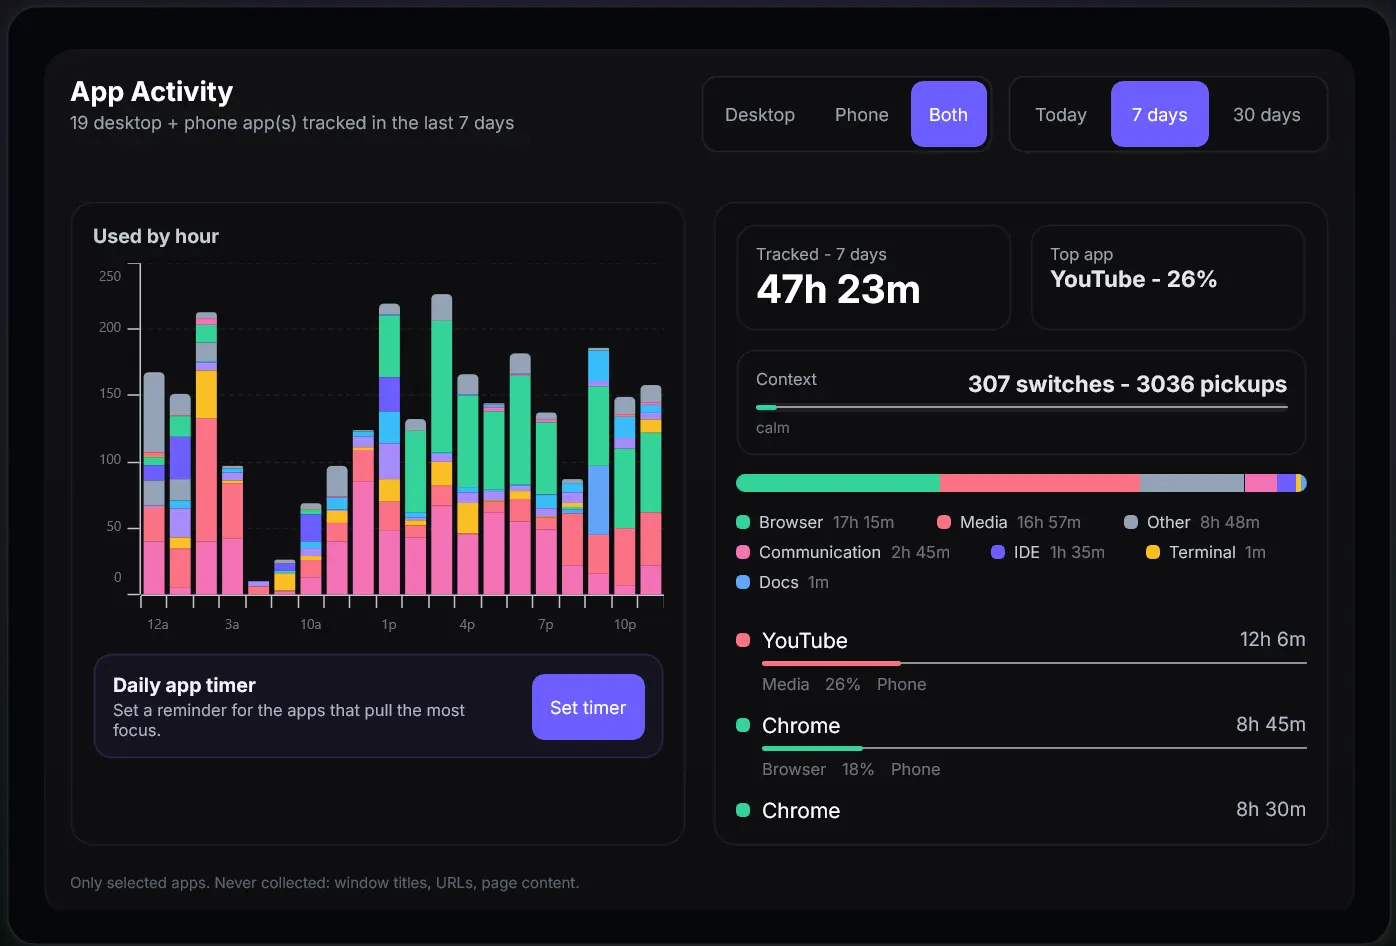
Put phone and desktop screen time on one timeline.
The Android companion adds phone pickups, mobile app use, and context switches to the desktop baseline. It enriches the picture without being required to start.
Optional context, never required.
Connect a wearable and Sarenica reads sleep, recovery, and HRV alongside your desktop signals. The desktop tracker keeps working without one — the wearable just sharpens the read.
Sleep, resting HR, steps and HRV via Health Connect.

Sleep score, readiness, body temperature.
Connections happen on the device. Wearable data is stored alongside your desktop signals in your local database and used for Hydrogen analysis — never pooled, never sold.
You hold the keys.
Every detector and every sync has its own explicit toggle. Counts and speed only; no keystrokes, no screen content, no video stored. Turn anything off and the rest keeps working.
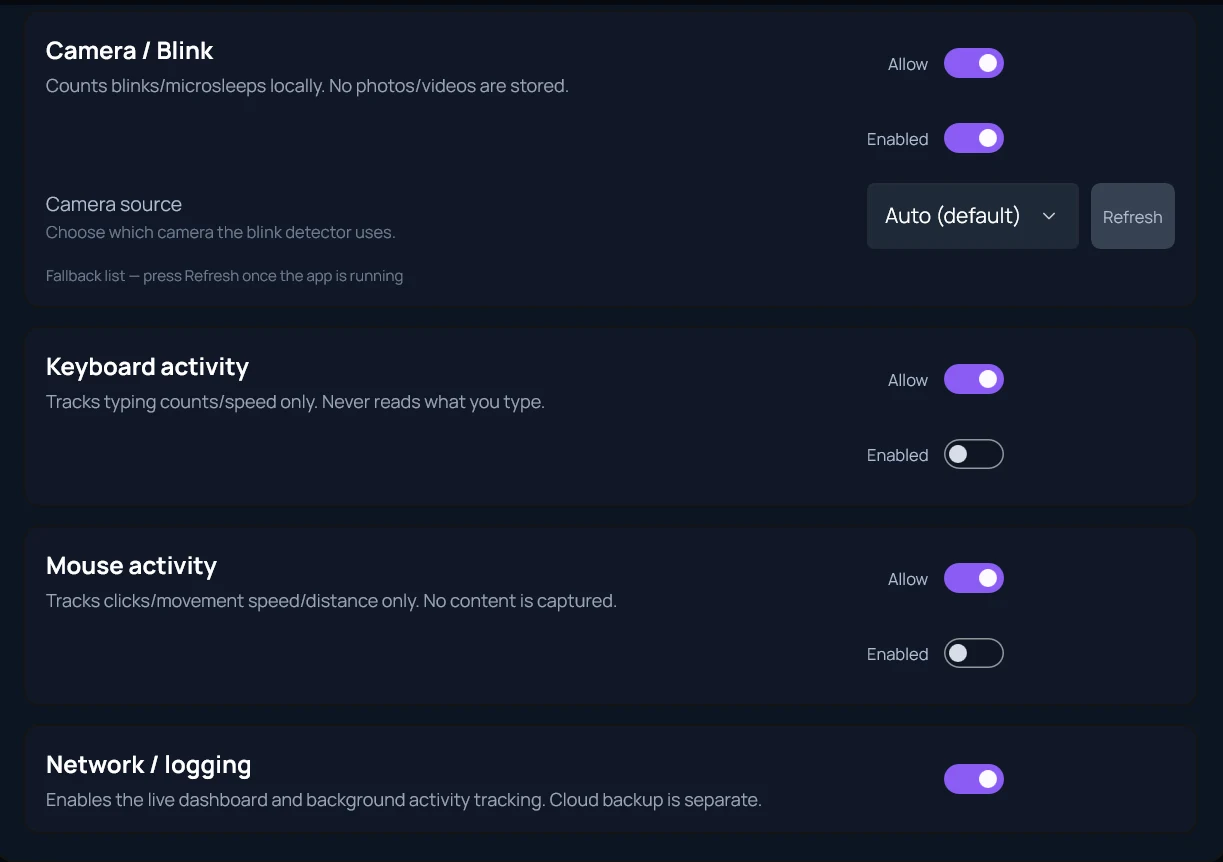
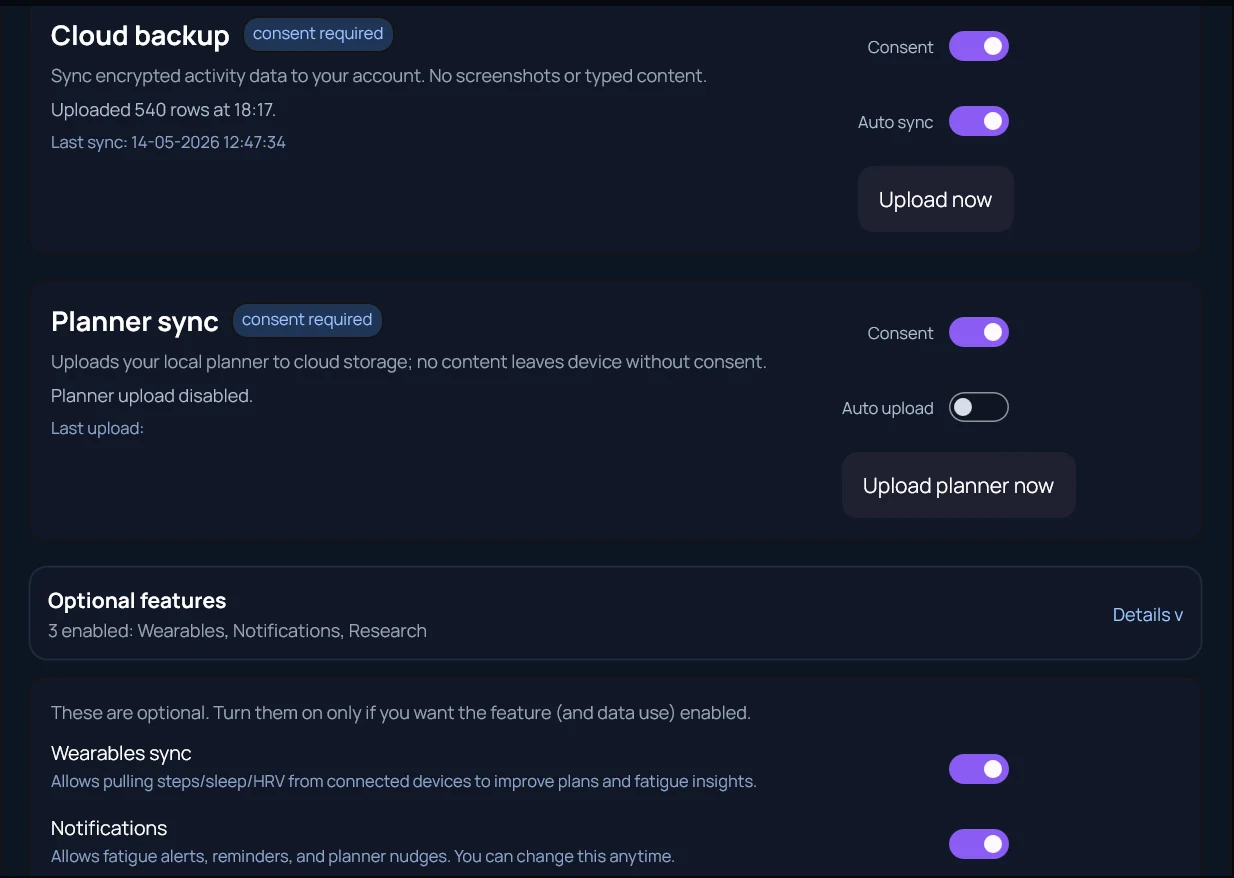
Your data never leaves your machine unless you ask it to.
Every signal is computed on your machine. Sync is opt-in. The app works without an account.
Native .NET MAUI binary. Idles at low CPU. No Electron, no bundled Chromium.
Distributed through the Microsoft Store with code signing and automatic updates.
Install on Windows in under a minute.
Then ask Hydrogen once you have a few real working days tracked.